Investors

Key Metrics

The quantitative foundation of a highly scalable, profitable logistics network.

To Explore
SCALE
THE METRICS GRID

Numbers that anchor the network

Every figure below is a physical, self -operated asset - the impenetrable core beneath our software layer.

  • 1,038,195 sq.ft

    California Self-Operated Mega-Hub

    Our flagship physical asset in California stands at a massive 1,038,195 square feet, acting as the impenetrable core of our nationwide self-operated fulfillment network.

  • 98%

    On-Time Delivery SLA

    Consistently exceeding industry benchmarks for final-mile delivery through physical network density combined with AI-driven predictive routing.

  • 24,000 FEUs

    Annual Container Throughput

    A record high in 2025 — processing over 24,000 forty-foot equivalent units and handling 1.38 million cartons with zero systemic bottlenecks.

  • 3000+

    Active Enterprise Clients

    A diversified, risk-resilient portfolio spanning apparel, consumer electronics, outdoor gear, and home furnishings.

  • 360+

    Proprietary Fleet Assets

    Heavy capital in our owned transportation network — 360+ trucks, port trailers, and long-haul vehicles for absolute supply-chain control.
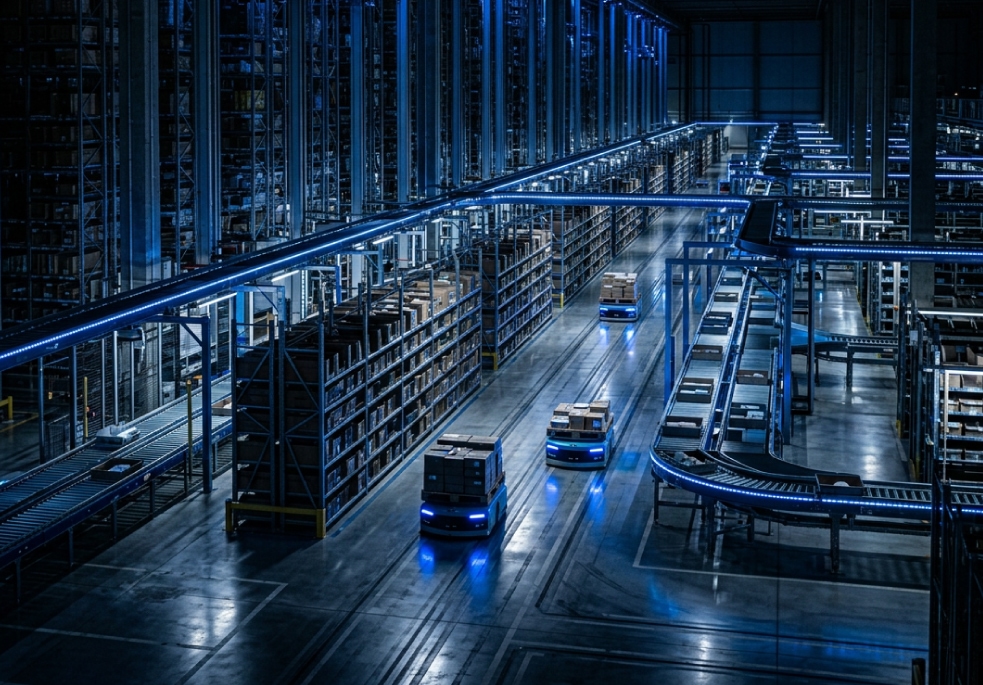
Heavy assets,engineered for software leverage.

Physical scale is only defensible when it is instrumented. Every square foot,container, and truck in the grid above feeds live data into our routing engine -turning a capital-intensive footprint into a predictable,
high-margin operating system.

The result is a network that gets cheaper and faster to run at scale, rather than more fragile - the economics investors look for in category defining infrastructure.

Read More
Faqs

You Ask We Answer

How often are these metrics updated?
Operational metrics (such as SLA accuracy, network uptime, and routing efficiency) are tracked in real-time through our proprietary WMS and aggregated monthly. Financial and physical footprint metrics—including CapEx deployment, total square footage, and unit economics—are updated quarterly in strict alignment with our financial reporting and audit cycles.
Is the 1,038,195 sq ft owned or leased?
The physical real estate is secured through long-term, direct strategic leases to maintain optimal capital agility. However, 100% of the operational infrastructure inside and outside these walls—including high-speed automated sorting conveyors, heavy-duty racking systems, robotics, and our dedicated transportation fleet—is fully owned Capital Expenditure (CapEx). We completely bypass short-term subleases and fragmented 4PL partner networks, ensuring absolute operational control over every square foot.
What drives the 98% on-time rate?
This industry-leading reliability is driven by the structural convergence of our Intelligent Routing software and decentralized physical footprint. By dynamically allocating inventory to the fulfillment node closest to the end consumer, our algorithm bypasses congested long-distance carrier zones. Furthermore, our automated pick-and-pack architecture and asset-owned truck fleet insulate our operations from third-party freight bottlenecks and localized labor shortages during peak seasons.
Can we access historical performance data?
Yes. Verified institutional investors, research analysts, and strategic partners who have successfully executed our Mutual Non-Disclosure Agreement (NDA) are granted access to our Virtual Data Room (VDR). The VDR houses comprehensive historical data, including quarterly operational SLA logs, cohort retention metrics, and audited financial performance spanning multiple high-volume promotional cycles.